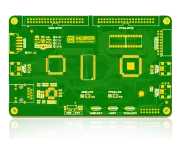
NextPCB Capabilities
Printed Circuit Boards
NextPCB Capabilities
Printed Circuit Boards
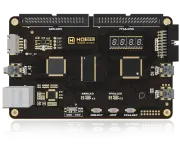
 PCB Assembly
 Layer Buildup
 SMD-Stencils
 PCB Design-Aid & Layout
 Mechanics
 Quality
 Drills & Throughplating
 Factory & Certificate
 PCB Assembly Factory Show
Certificate
PCB Assembly Factory Show
Certificate
Support Team
Feedback:
support@nextpcb.com


1. Test calibration method
Among the three commonly used test instruments, the network analyzer calibration method is the most rigorous, the spectrum analyzer is second, and the oscilloscope calibration method is the simplest.
There are three methods, Thru, TRL and SOLT.
The essence of Thru is normalization. When the calibration is performed, the network analyzer records the test result of the fixture (S21_C). In the actual test, the test result (S21_M) is directly divided by S21_C, and the test result of the test piece is obtained (S21_A). . Thru calibration ignores the reflections caused by mismatches in the test fixture and the electromagnetic coupling in space, so it has the lowest calibration accuracy. This calibration method can be used when only S21 is tested and the test accuracy is not high.
In non-Coaxial structures such as PCBs, it is sometimes necessary to test the characteristics of traces, vias, connectors, and the like. In this case, the test instrument supplier does not provide a standard calibration piece, and it is difficult for the tester to make a good open circuit, short circuit, matching load and other calibration parts in the test calibration port. Therefore, the conventional SOLT calibration cannot be performed. The advantage of using TRL calibration is that standard calibration kits are not required and the test calibration port can be extended to the desired position. At present, the use of TRL calibration in PCB structure testing has been extensive.
SOLT is generally considered to be the standard calibration method. There are 12 calibration error parameters in the calibration model. Calibration calculations are performed for various errors by using short circuit, open circuit, load and through. Since test instrument vendors typically only offer Coaxial calibrations, the SOLT calibration method cannot be used in non-Coaxial configurations.
The above three calibration methods can be analyzed in detail by means of signal flow diagrams, wherein each error parameter has corresponding parameters in the signal flow diagram. Through the signal flow diagram, the error sensitivity of various calibration methods can be clearly understood to understand the error range of the actual test. One point that needs to be addressed here is that even with the standard SOLT calibration method, five error parameters are ignored in the calibration model. Normally, these five error parameters do not affect the calibration accuracy. However, if you do not pay attention to the design of the calibration fixture during use, there will be a phenomenon that cannot be corrected.
A standard source is provided inside the spectrum analyzer for calibration. The calibration requires only the internal standard source to be connected to the input port through the test fixture. The calibration takes about 10 minutes. The calibration of the oscilloscope is much simpler. Connect the probe to the internal standard source and confirm it. The calibration takes about 1 minute.
2. Passive device modeling method
As the signal rate continues to increase, the role of passive components in the signal chain is becoming more and more important. The accuracy of system performance simulation is often determined by the model accuracy of passive components. As a result, testing and modeling of passive components is becoming an important part of the PCB interconnect design of individual equipment vendors. Common passive components are as follows:
Connector
PCB traces and vias
capacitance
Inductance (magnetic beads)
In high-speed signal integrity designs, connectors have the greatest impact on signal links. For high-speed connectors that are frequently used, it is common practice to perform calibration fixtures in accordance with the TRL calibration method and test the connectors for simulation analysis. PCB trace and via test modeling methods are similar to connectors, and TRL calibration is also used to move the test port to the desired location and then test the modeling.
Capacitance models are used in signal integrity analysis, and more important applications are in power integrity analysis. The commonly used capacitance modeling instruments in the industry are impedance analyzers and network analyzers, which are suitable for different frequency bands, impedance analyzers for low frequency bands, and network analyzers for high frequency bands. If a network analyzer is used for power integrity testing in a specific test, it is recommended to use a network analyzer in the full frequency band of the capacitor modeling to ensure consistency of modeling and application. Due to the small impedance of the capacitor, parallel mode is often used when modeling with a network analyzer. The problem that the industry has not solved in capacitive modeling is how to eliminate the mutual coupling between the fixture and the capacitor to reduce the influence of the fixture on the modeling result.
In traditional power supply designs, inductors (magnetic beads) are often used to isolate the power supply to reduce noise interference. In actual design, it is often the case that the isolation inductance (magnetic beads) is removed, and the noise of the power supply is reduced. This is due to the inductance (beads) resonating with other filter components. To avoid this, it is necessary to model and simulate the inductor (beads) to avoid resonance. The commonly used inductor (magnetic bead) modeling method is also a network analyzer. The specific method is similar to the capacitance modeling. The difference is that the inductor (magnetic bead) is modeled in series, and the capacitor is modeled in parallel.
3. Power integrity test
As the power of the chip continues to increase and the operating voltage continues to decrease, the ground noise of the power supply has gradually become the focus of attention in PCB interconnect design. From the perspective of the test object, the power integrity test can be divided into two steps, power system characteristic test and power ground noise test. The former is the test of the performance of the system power supply (passive test), the latter is the power ground noise (active test) when the direct test system works, and the synchronous switch noise can also be classified as the power ground noise.
When testing power system performance, a network analyzer is typically used, and the test object is the Self-Impedance and Transfer-Impedance of the power system. Under normal circumstances, the impedance of the power system is much smaller than the impedance of the network analyzer system (50 ohms), so only straight-through calibration is required during the test. The impedance of the power system can be obtained by using the formula S21=Z/25.
The spectrum of the test power can be used with a spectrum analyzer and an oscilloscope. The input port of the spectrum analyzer cannot be connected to the DC component. Therefore, when testing the ground noise of the power supply, DC-Blocking must be connected in series in the test fixture. The input impedance of the spectrum analyzer is 50 ohms, and the impedance of the power ground network is generally milliohms, so the test fixture does not affect the system to be tested. The input impedance of the oscilloscope varies with the settings. Take the Tektronix TDS784 as an example. The low-frequency cut-off frequency varies with the coupling mode and system impedance.
The method described above is to test the noise of the power supply on the board, and the real impact on the chip is the noise of the power supply in the chip. At this time, the synchronous switch noise test is needed to determine the noise of the power supply in the chip. Let the chip have N IO ports, so that one of them remains static, and N-1 flips at the same time to test the signal waveform on the static network, that is, synchronous switching noise. Synchronous switching noise includes both ground noise and crosstalk between different signals in the package. There is currently no way to completely separate the two.
4. Test method for clock signal jitter
In some high-end products, jitter has gradually become an important indicator affecting product performance. Here is only a brief introduction to how to use the spectrum analyzer to test clock signal jitter and problem location. The jitter test on data signals is not involved.
In most systems, the clock is generated by a crystal or phase-locked loop. The jitter test of the clock signal is relatively simple, no high-end test equipment is needed, and the problem can be solved by using a common spectrum analyzer. The spectrum of an ideal clock signal is a clean discrete spectrum with components only at a multiple of the clock frequency. If the clock signal is dithered, side lobes appear in the vicinity of these octaves, and the magnitude of the jitter is proportional to the power of these side lobes.
The specific method of testing the clock jitter by using the spectrum analyzer is to find a testable point on the clock signal link, and connect the point signal to the spectrum analyzer through DC-Blocking to observe the test result. Since the test fixture is a linear system, there is no need to worry about generating new spectral components. The aforementioned clocks are all generated by crystal or phase-locked loops. In this case, the important reason for introducing clock jitter is the power supply noise of the crystal or phase-locked loop. Using the method described above to test the power supply noise of the resulting crystal or phase-locked loop, compared with the side lobes in the clock spectrum, the cause of the clock jitter can be basically determined. The solution to the problem is to redesign the filter circuit of the crystal or phase-locked loop according to the sidelobes of the clock spectrum. Under normal circumstances, these problems can be solved by properly selecting the filter capacitor.
Still, need help? Contact Us: support@nextpcb.com
Need a PCB or PCBA quote? Quote now


 Surface