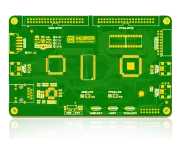
NextPCB Capabilities
Printed Circuit Boards
NextPCB Capabilities
Printed Circuit Boards
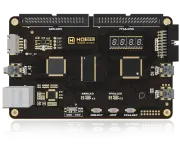
 PCB Assembly
 Layer Buildup
 SMD-Stencils
 PCB Design-Aid & Layout
 Mechanics
 Quality
 Drills & Throughplating
 Factory & Certificate
 PCB Assembly Factory Show
Certificate
PCB Assembly Factory Show
Certificate
Support Team
Feedback:
support@nextpcb.com


Loss effect
When the signal frequency increases, the attenuation on the transmission line cannot be ignored. At this time, it is necessary to consider the loss caused by the series resistance of the conductor and the equivalent conductance of the parallel connection of the medium, and the lossy transmission line model is used for analysis.
Characterizing the losses is the equivalent series resistance R and the equivalent parallel conductance G. The equivalent series resistance R is the resistance caused by the direct current resistance and the skin effect, and the direct current resistance is the resistance of the conductor itself, which is determined by the physical structure of the conductor and the resistivity of the conductor. When the frequency increases, the skin effect begins to function. The skin effect is a phenomenon in which the signal current in the conductor concentrates on the surface of the conductor when the high-frequency signal passes through the conductor. Inside the conductor, the current density along the conductor cross-section is exponentially attenuated, and the depth at which the current density decreases to 1/e is called the skin depth. The higher the frequency, the smaller the skin depth, resulting in an increase in the resistance of the conductor. The skin depth is inversely proportional to the square root of the frequency.
The equivalent parallel conductance G is also referred to as dielectric loss. At low frequencies, the equivalent parallel conductance is related to the bulk conductivity and equivalent capacitance of the medium, and as the frequency increases, the dielectric loss angle begins to dominate. The dielectric conductivity at this time is determined by the dielectric loss angle and the signal frequency.
In general, when the frequency is less than 1 GHz, the skin effect loss plays a major role, and when the frequency is above 1 GHz, the dielectric loss dominates.
In the simulation software, the dielectric constant, dielectric loss angle, conductor conductivity, and cutoff frequency can be set. The software will consider the effect of skin effect and dielectric loss according to the structure of the transmission line during the simulation. If the simulation is attenuated, the corresponding cutoff frequency must be set according to the bandwidth of the signal. The bandwidth is determined by the signal edge rate. Many 622MHz signals have little difference with the 2.5GHz signal edge rate. In addition, the equivalent of the lossy transmission line model can also be seen. Resistance and conductance vary with frequency.
Loss slows the rising edge of the signal, which reduces the bandwidth of the signal, and the loss reduces the amplitude of the signal. On the other hand, this is good for suppressing signal overshoot.
The crosstalk of the transmission line also affects the loss. The crosstalk is determined by the physical structure of the transmission line, the coupling length, the signal strength, and the edge rate. After a certain length, the crosstalk will be saturated, but the loss does not necessarily increase.
Via and connector effects
The vias deliver the signal to the other side of the board. The vertical metal portion between the boards is uncontrolled impedance, and the inflection point that changes from horizontal to vertical is a breakpoint that produces reflections and should be minimized.
In the gigabit system design simulation, the influence of vias should be considered, and a via model is required. The via the structure of the via is in the form of series resistor R, inductor L and shunt capacitor C. Depending on the application and accuracy requirements, multiple RLC structures can be used in parallel and considering coupling to other conductors. The via model is a matrix.
There are two methods for obtaining the via model, one is obtained by testing, for example, by TDR, and the other can be extracted by the 3D field extractor (FieldSolver) according to the physical structure of the via.
The via model parameters are related to the PCB material, stack, thickness, pad/anti-pad size, and how the connections to it are connected. In the simulation software, different parameters can be set according to the accuracy requirements, and the software extracts the model according to the corresponding algorithm and considers its influence in the simulation.
In the design of the Gigabit system PCB, the influence of the connector should be specially considered. Now the development of the high-speed connector technology can well guarantee the continuity of the impedance and the ground plane during signal transmission. The simulation analysis of the connector in the design is mainly A multi-line model is used.
The connector multi-line model is a model extracted in three dimensions, taking into account the inductance and capacitive coupling between the pins. The connector multi-line model generally uses a three-dimensional field extractor to extract the RLGC matrix, typically in the form of a Spice model subcircuit. Due to the complex structure of the model, it takes a long time to extract and simulate the analysis. In the SpecctraQuest software, the Spice model of the connector can be edited into an Espace model, assigned to the device or directly called, or edited into a DML format package model for use by the device.
Differential signal and wiring considerations
The differential signal has the advantages of strong anti-interference and high transmission rate. In the gigabit signal transmission, the influence of crosstalk, EMI, etc. can be better reduced. The coupling form has the form of edge coupling and up-and-down coupling, loose coupling, and tight coupling.
Compared with upper and lower coupling, edge coupling has the advantages of better crosstalk reduction, convenient wiring, and simple processing. Upper and lower coupling is more often applied to PCB boards with high wiring density. The tight coupling has better anti-interference ability than loose coupling and can reduce crosstalk. Loose coupling can better control the continuity of differential trace impedance.
The specific differential routing rules should consider the effects of impedance continuity, loss, crosstalk, and trace length differences according to different situations. The differential line is best used to analyze the simulation results using an eye diagram. The simulation software can set the random sequence code to generate the eye diagram and can input the jitter and offset parameters to analyze its influence on the eye diagram.
Power distribution and EMC
The increase in data transfer rate is accompanied by a faster edge rate, which requires power supply stability over a wider frequency band. A high-speed system may pass a transient 10A current and require a maximum ripple of 50mV, which means that the impedance of the power distribution network within a certain frequency range is within 5mΩ. For example, the rise time of the signal is less than 0.5ns. The bandwidth is up to 1.0GHz.
In gigabit system design, synchronous noise (SSN) interference is avoided to ensure that the power distribution system has a lower impedance over the bandwidth. Generally, in the low-frequency band, the decoupling capacitor is used to reduce the impedance, and the high frequency band mainly considers the power supply and the ground plane distribution.
SpecctraQuest software can analyze the influence of synchronous noise caused by the package structure. power integrity (PI) software uses a frequency domain analysis power distribution system to effectively analyze the number and position of decoupling capacitors and the influence of power and ground planes. Decoupling capacitor selection and placement, routing, and plane distribution analysis.
Still, need help? Contact Us: support@nextpcb.com
Need a PCB or PCBA quote? Quote now


 Surface