Support Team
Feedback:
support@nextpcb.comFor digital circuits, the output is usually a square wave signal. The rising edge of the square wave is very steep. According to the Fourier analysis, any signal can be decomposed into a series of sinusoidal signals of different frequencies. The square wave contains a very rich spectral component.
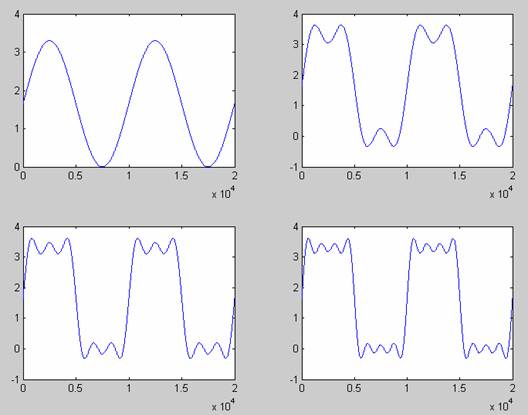
Aside from the boring theoretical analysis, we use experiments to visually analyze the frequency components in the square wave to see how the sinusoidal signals of different frequencies are superimposed into square waves. First, we superimpose a 1.65v DC and a 100MHz sinusoidal waveform to obtain a single-frequency sine wave with a DC bias of 1.65v. We add this signal to an integer multiple of the frequency of the sinusoidal signal, also known as the harmonic. The frequency of the 3rd harmonic is 300MHz, the frequency of the 5th harmonic is 500MHz, and so on, the higher harmonics are integer multiples of 100MHz. Figure 1 is a comparison of before and after superimposing different harmonics. The upper left corner is the 100MHz fundamental frequency waveform of the DC offset, and the waveform of the 3rd harmonic is superimposed on the fundamental frequency in the upper right corner, which is somewhat similar to the square wave. The lower left corner is the waveform of the fundamental frequency + 3rd harmonic + 5th harmonic, and the lower right corner is the waveform of the fundamental frequency + 3rd harmonic + 5th harmonic + 7th harmonic. Here you can visually see that the more harmonic components are superimposed, the more the waveform looks like a square wave.

Figure 1
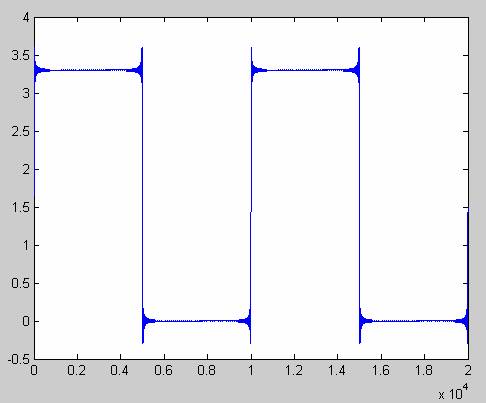
So if we add enough harmonics, we can approximate the square wave. Figure 2 is a waveform after superimposing on the 217th harmonic. Already very similar to the square wave, do not care about the burrs on the corner, that is the famous Gibbs phenomenon, this simulation is bound to have, but does not affect the understanding of the problem. Here we have the highest frequency of superimposed harmonics reaching 21.7GHz.

Figure 2
The above experiment is very helpful for us to understand the essential characteristics of the square wave waveform. The ideal square wave signal contains an infinite number of harmonic components. It can be said that the bandwidth is infinite. The actual square wave signal is different from the ideal square wave signal, but one thing that is common is the spectral component with high frequency.
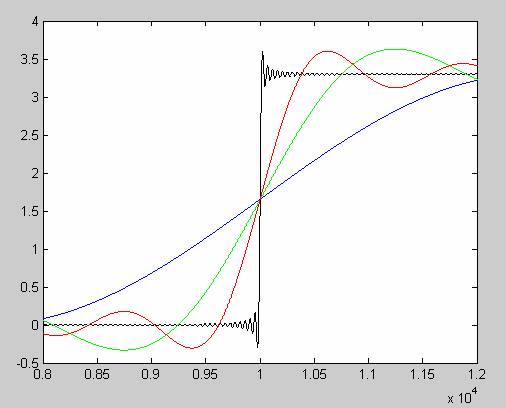
Now let's look at the effect of superimposing different spectral components on the rising edge. Figure 3 is a comparison display. Blue is the rising edge of the fundamental frequency signal, green is the rising edge of the waveform after the 3rd harmonic is superimposed, and red is the rising edge after the fundamental frequency + 3rd harmonic + 5th harmonic + 7th harmonic, black is The rising edge of the waveform after being superimposed to the 217th harmonic.

Image 3
Through this experiment, it can be intuitively seen that the more harmonic components, the steeper the rising edge. Or from another perspective, if the rising edge of the signal is steep and the rise time is short, the bandwidth of the signal is very wide. The shorter the rise time, the wider the bandwidth of the signal. This is a very important concept. It must have an intuitive understanding, deep in the mind, which is very good for you to learn signal integrity.
Here, the final synthesized square wave has a waveform repetition rate of 100 MHz. Superimposing harmonics only changes the signal rise time. The signal rise time is independent of the frequency of 100MHz, and the same is true for 50MHz. If your board's output data signal is only a few tens of MHz, you may not care about signal integrity issues. But then you think about the effects of the high frequency harmonics in the spectrum due to the short rise time of the signal. Remember an important conclusion: what affects signal integrity is not the repetition frequency of the waveform, but the rise time of the signal.
The simulation code in this article is very simple, I posted the code here, you can run it on Matlab yourself.
Clc; clear all; pack;
Fs = 10e9;
Nsamp = 2e4;
t = [0:Nsamp-1].*(1/Fs);
F1 = 1e6;
X0 = 3.3/2;
X1 = x0 + 1.65*sin(2*pi*f1*t);
X3 = x0;
For n=1:2:3
X3 = x3 + 3.3*2/(pi*n) * sin(2*pi*n*f1*t);
End
X5 = x0;
For n=1:2:5
X5 = x5 + 3.3*2/(pi*n) * sin(2*pi*n*f1*t);
End
X7 = x0;
For n=1:2:7
X7 = x7 + 3.3*2/(pi*n) * sin(2*pi*n*f1*t);
End
Figure
Subplot(221)
Plot(x1)
Subplot(222)
Plot(x3)
Subplot(223)
Plot(x5)
Subplot(224)
Plot(x7)
X217 = x0;
For n=1:2:217
X217 = x217 + 3.3*2/(pi*n) * sin(2*pi*n*f1*t);
End
Figure
Plot(x217)
Figure
Plot(x217,'k')
Hold on
Plot(x1,'b')
Plot(x3,'g')
Plot(x7,'r')
Hold off
Axis ([8000 12000 -0.5 4])
Still, need help? Contact Us: support@nextpcb.com
Need a PCB or PCBA quote? Quote now