Introduction
The Raspberry Pi is a Tiny, Low-cost single-board PC (Personal computer) that is extremely versatile and Strong for its size. Due to its low cost, small form factor, and variety of features, it is a well-liked platform for all kinds of projects from desktop replacements to robots and industrial applications.
However, due to its relatively limited processing power and memory when compared to full-sized computers, understanding and monitoring the resources used by programs and processes running on the Pi is important. This helps to ensure the Pi is not overloaded which could result in slow performance or even crashing. Resource monitoring also aids in optimizing software and hardware configurations.
There are a few key resources that are important to monitor on the Raspberry Pi - CPU usage, memory usage (RAM), disk usage, and network traffic. By having tools that provide visibility into these metrics, problems can be identified and addressed before they impact the usability or reliability of the Pi. This article will explore some effective options for monitoring resources on the Raspberry Pi to help keep your projects running smoothly.
CPU Usage Monitoring
The central processing unit, or CPU, is the brain of the Raspberry Pi that Controls all the computations and processing of code. Knowing how much of the CPU is being utilized by programs and processes gives good insight into the demands being placed on the system. Constant high CPU usage could indicate insufficient processing power for a task or inefficient software.
One simple built-in tool for monitoring CPU usage on the Pi is top. To use it, open a terminal window and type ‘top’. This will display a list of running processes along with their percentage CPU usage. You'll see the total CPU usage across all processor cores as well as individual core usages. Top automatically refreshes every few seconds so you can watch how usage changes over time.
Some key values to pay attention to in top are:
- %CPU - The total percentage of CPU cycles spent on non-idle processes. High overall usage could impact performance.
- CMD - Shows the names of programs/processes consuming the most CPU to help identify optimization opportunities.
- USER - Indicates which user account owns the process. Useful for tracking down rogue programs.
For a more graphical interface to monitor CPU usage, you can install the top utility. It provides an enhanced text-based visual similar to Windows Task Manager. As with the top, just type 'htop' in a terminal to launch it.
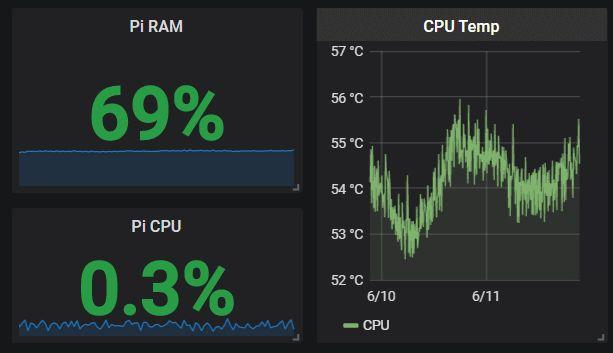
For monitoring across multiple Pis or visualizing trends over time, some options include collecting CPU data with tools like collected and storing it in a time-series database like Influx db for querying and graphing. Grafana can then be used to create nice interactive CPU usage dashboards.
Get Free PCB Assembly
Memory (RAM) Usage Monitoring
Keeping an eye on memory (RAM) usage is also important for ensuring the Raspberry Pi remains responsive. The Pi models have relatively low amounts of RAM ranging from 512MB to 4GB depending on the board. Programs need to stay within these limits to avoid swapping to slower storage.
Top and htop, the CPU monitoring tools mentioned earlier, both also show memory usage details. Top breaks it down into buffers, cache and available memory. Htop provides an interactive overview of per-process memory footprints.
For a deeper dive into memory stats, free is useful. It reports total, used and free RAM as well as memory used by caches. To run it, type 'free -m' which displays the output in megabytes. Pay attention to the -/+ buffers/cache lines which indicate the amount of memory being used as disk cache buffers which could be reclaimed if needed.
Long term memory profiling of applications is possible using tools like ram watch or Monitoring RAM usage over time allows spotting memory leaks or inefficient usage patterns. Storing results in Influxdb/Grafana makes memory trends visible.
Disk Usage Monitoring
With limited storage capacities ranging from a few gigabytes to 32GB maximum, keeping an eye on disk usage is prudent. Knowing which files and folders are consuming the most space helps clean up unused data to prevent filling disks. It also aids in right-sizing storage specifications for projects.
The df command reports disk space usage and available space. To see a summary, run 'df -h'. It shows mounted filesystems and their used/available space in human-readable format.
For more detail on where space is being used, du (disk usage) is helpful. To recursively check all directories and files starting from root ('/'), run 'du -sh /*' to get totals per top-level folder. You can also check a specific path like 'du -sh /home/pi/Photos' to understand how much space a folder is using.
For graphical disk monitoring and automated storage thresholds, collected with Influxdb/Grafana is again a good choice. It's possible to draw disk usage charts and create alerts when certain usage percentages are breached.
Network Traffic Monitoring
Knowing how much network traffic applications are generating aids in bandwidth planning, troubleshooting connectivity issues and spotting anomalies. Some common tools for monitoring network interfaces on the Raspberry Pi include:
- iftop: A real-time tool showing network usage on Linux systems similar to Windows' Resource Monitor. Run 'iftop' and see upload/download speeds on interfaces like eth0 or wlan0.
- ifstat: A simpler interface statistics tool showing inbound/outbound rates on interfaces.
- ntopng: A powerful network monitoring platform that provides in-depth traffic analysis and flow monitoring. Needs to be installed separately.
- collectd + Influxdb: As with other metrics, network data can be collected by collectd and stored in Influxdb with Grafana for visualization over periods of time.
Integrated Monitoring with OS Tools
Thankfully, the Linux operating systems used by Raspberry Pis like Raspbian provide some integrated tools to monitor multiple resources together without needing additional software:
- System Monitor (formerly called RPi-Monitor): A graphical monitoring tool that ships with standard Raspbian images. Launch with 'sudo raspi-config' and go to 'Performance Options'. Shows CPU/GPU, memory, disk, network and temperature stats. Very convenient for at-a-glance checking.
- System Resource Utility: Another GUI tool that monitors CPU, memory, disks, processes and network. Launch with 'sudo system_monitor'.
- System Activity Report: Provides an overview of top processes, network and disk I/O activity. Launch with 'iotop'.
- Top - As mentioned earlier, top continues to be very useful for monitoring changing CPU and memory usage quickly from the terminal.
So in summary, the Raspberry Pi has a variety of helpful built-in monitoring capabilities and the Linux tradition of simple but powerful command line tools continue to serve administrators well here. With some additional configuration, solutions like Influxdb/Grafana greatly enhance long term visibility, alerting and analytics capabilities too.
Remote Resource Monitoring
For Raspberry Pis deployed in remote locations like industrial environments, kiosks or distributed IoT nodes, having the ability to check resource usage from anywhere is important. Luckily there are options:
- SSH access allows running command line tools like top, iftop etc from any machine on the LAN or internet. Pair with tools that allow port forwarding through routers.
- Connect monitoring software to a centralized, internet-accessible database like Influxdb. Visualize from anywhere with Grafana.
- Use a remote access/management product designed for IoT like MeshCommander that provides integrated device, OS and app/service monitoring over web dashboards.
- Some specialized hardware for industrial use like IO Raspberry Pi HATs contains built-in web servers with remote resource monitoring pages accessible over LAN/WAN.
- For headless Pis without monitors/mice, consider solutions like Pi Monitor that install a web server for remote monitoring of live stats via a browser.
So in summary, with a combination of open source/freeware and commercial solutions, remote resource monitoring of Raspberry Pis is very achievable even for widely distributed deployments. The key is ensuring connectivity whether through typical networking methods or specialized hardware.
Get Free PCB Assembly
Monitoring at Scale
For large fleet deployments of tens to hundreds of Raspberry Pis, manually checking each one becomes infeasible. Centralized monitoring platforms are needed. Here are some suitable open source options:
- Prometheus - A popular metrics and monitoring system. Collects metrics from exporters running on Pis and stores in its time-series database. Visualize with Grafana.
- Zabbix - A full-featured enterprise-grade monitoring solution. Install Zabbix server + Zabbix agent on Pis. Checks CPU/memory/disk usage. Email/SMS alerts.
- Nagios - Very flexible and extensible traditional monitoring tool. Install Nagios server + Nagios agent on Pis. Check services and resources. Notifications via email/SMS.
- Sensu - A monitoring event pipeline that delivers alerts. Lightweight agents run checks on Pis and report to the Sensu server which triggers alerts and visibility dashboards.
- LibreNMS - Automatically discovers devices on network and monitors system health. Integrates resource collection from Linux servers/devices like Pis.
For these systems, use tools on Pis like collectd, Node Exporter etc to expose hardware and OS metrics that can be scraped by central monitoring platforms. Combines distributed resource collection with centralized visibility, analytics and alerting.
Thermal Monitoring
- The Raspberry Pi does not have built-in temperature sensors, so an external temperature sensor HAT or board is required.
- Popular options include the Raspberry Pi Sense HAT which has an 8x8 RGB LED display and integrated sensors including temperature.
- Others include AM2320, DS18B20 and SI7021 temperature and humidity sensors that connect via I2C and report temperature in Celsius.
- Open source tools exist to read temperature values from these sensors like raspi-temp to display current temp or log readings over time.
- High temperatures could impact stability and lifespan, so monitoring helps ensure adequate cooling is provided. Alerts can trigger if certain thresholds are exceeded.
- Top thermal monitoring systems visualize temperatures across multiple Pis in real-time dashboards for industrial/server environments.
Power Monitoring
- The Raspberry Pi does not have a built-in current/power sensor either, so an external USB attachment is needed.
- Popular ones are USB power monitors like the Plugwise Circles or Emporia Energy which report voltage, current and power usage in Watts to connected devices over USB.
- They integrate with tools like PowerPi to read the sensors and record consumption over time on the Pi itself.
- More advanced power monitor boards exist that provide on-board storage/display as well as sensors and can connect to monitoring platforms.
- Tracking power usage helps optimize efficiency, reduce costs and ensure adequate power supplies especially for 24/7 deployments.
So in summary, while not native functionality, there are many affordable sensor options and open source software for monitoring thermal and power metrics on Raspberry Pi systems too for health and optimization insights.
Optimizing Power Usage:
- Monitor power draws of different software workloads to find inefficient ones
- Underclock CPU or adjust governor settings for lower average power usage
- Overclock memory if headroom exists to boost performance within same power envelope
- Use USB vs Ethernet vs WiFi - each has different power characteristics
- Add heatsinks, fans or active cooling to allow lower voltage/frequency settings
- Reduce unnecessary services, background tasks to lower overall draw
- Select Pi board model based on required power vs performance characteristics
Addressing Thermal Issues:
- Monitor temperature impacts of different enclosure/case designs
- Check for adequate ventilation holes and airflow over components
- Thermal pads or paste between components and mounting surfaces
- Relocate to cooler ambient environment if temperatures exceeded
- Calibrate/check any thermal sensor readings for accuracy
- Log temperatures at idle vs under load to spot thermal design issues
Centralized Monitoring:
- Pull metrics into InfluxDB from multiple edge devices
- Visualize temperature/power trends and outlier devices over time
- Set thermal/power thresholds and alert on breaches
- Correlate thermal/power events with other metrics/logs
- Track device uptime/reliability metrics in harsh environments
- Optimize large fleets of devices and catch thermal/power issues early
So in summary, keeping an eye on these lesser monitored but important factors helps optimize deployments, improve reliability and extend component lifespans through proper thermal/power management strategies.
Get Free PCB Assembly
Remote Resource Monitoring
For Raspberry Pis deployed in remote locations like industrial environments, kiosks or distributed IoT nodes, having the ability to check resource usage from anywhere is important. Luckily there are options:
- SSH access allows running command line tools like top, iftop etc from any machine on the LAN or internet. Pair with tools that allow port forwarding through routers.
- Connect monitoring software to a centralized, internet-accessible database like Influxdb. Visualize from anywhere with Grafana.
- Use a remote access/management product designed for IoT like MeshCommander that provides integrated device, OS and app/service monitoring over web dashboards.
- Some specialized hardware for industrial use like IO Raspberry Pi HATs contain built-in web servers with remote resource monitoring pages accessible over LAN/WAN.
- For headless Pis without monitors/mice, consider solutions like PiMonitor that install a web server for remote monitoring of live stats via a browser.
Ensuring proper authentication and authorization is important when exposing monitoring endpoints publicly over the internet. Tools like basic HTTP authentication, TLS client certificates or a VPN can help secure access. Logging into dashboards should also be tied to appropriate user accounts for auditing purposes.
So in summary, with a combination of open source/freeware and commercial solutions, remote resource monitoring of Raspberry Pis is very achievable even for widely distributed deployments. The key is ensuring connectivity whether through typical networking methods or specialized hardware.
You may also be interested in...
- How to turn a Raspberry pi into a Router
- How to Get Started With Raspberry Pi
- How To Play Audio with The Raspberry Pi
- Free PCB Assembly Offer is Now Live: Experience Reliable PCB Assembly from HQ NextPCB
- HQ NextPCB Introduces New PCB Gerber Viewer: HQDFM Online Lite Edition